Troubleshooting High RAM Spikes on Linux
Updated 2026-08-11
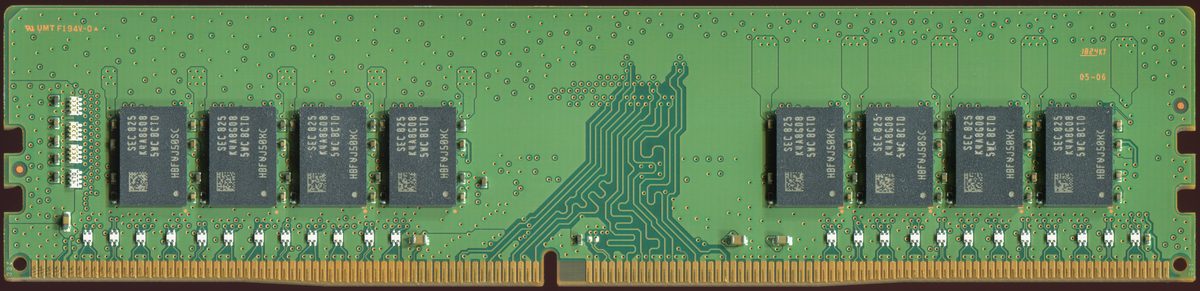
Identify memory leaks, OOM kills, and cache bloat in Docker and Kubernetes environments.
Quick Diagnosis Checklist
- Check available memory:
free -h - Identify memory hogs:
ps aux --sort=-%mem | head -10 - Check cache pressure:
cat /proc/pressure/memory - Review OOM events:
dmesg | grep -i oom | tail -20 - Analyze container stats:
docker stats --no-stream
1. Memory Types: RSS vs VSZ vs PSS
Understanding memory metrics prevents misdiagnosis:
- RSS (Resident Set Size): Physical memory actually in RAM right now
- VSZ (Virtual Memory Size): All memory allocated (includes swap, mapped files)
- PSS (Proportional Set Size): Fair share of shared memory (most accurate for comparison)
When troubleshooting, focus on RSS and PSS, not VSZ.
2. Identify Process Memory Leaks
Scenario: A container’s memory grows continuously over days.
ps -eo pid,user,vsz,rss,comm | grep nginx

# Monitor memory trend over time
watch -n5 'ps aux | grep -E "nginx|$1" | grep -v grep'

# Use pmap to see memory regions
pmap -x $(pgrep -f myapp) | tail -20
Fix: restart the container with memory limits. If memory usage stabilizes after restart, it’s a leak.
3. Docker & Kubernetes Memory Issues
Check Docker Container Memory Usage
# See all containers and their memory usage
docker stats --no-stream --format "table {{.Container}}\t{{.MemUsage}}\t{{.MemPerc}}"

# Inspect a specific container
docker inspect <container-id> | grep -A 20 '"Memory"'

# View memory limit
docker inspect <container-id> | grep '"Memory"'
Kubernetes Pod Memory Pressure
# Check pod resource requests and limits
kubectl describe pod <pod-name> -n <namespace>

# View actual usage vs limits
kubectl top pods -n <namespace>

# Get memory pressure events
kubectl get events -n <namespace> --sort-by='.lastTimestamp' | grep Memory
Warning: If requests < actual usage, Kubernetes may evict the pod during node memory pressure.
4. Linux Page Cache Issues
Scenario: Free memory shown as 100MB, but “Cached” is 8GB (system is fine, not a problem)
# Detailed memory breakdown
free -h

# Shows: Total | Used | Free | Shared | Buffers | Cached
The system automatically reclaims page cache when applications need memory. This is normal and good.
If Cache Won’t Release (Very Rare)
# Drop caches (requires root, causes brief I/O spike)
sync
echo 3 > /proc/sys/vm/drop_caches

# Verify
free -h
Warning: Dropping caches damages performance. Only do this during maintenance windows.
5. Memory Pressure & Swap
Scenario: Swap is being used heavily, system is slow.
# Check swap usage
swapon --show
free -h

# Monitor page swap rate
vmstat 1 10

# Check swap reads/writes
iostat -x 1 5 | grep -E "sda|read|write"
Solutions
- Increase RAM: Best option if budget allows
- Reduce swappiness: Tell the kernel to prefer RAM reclamation over swap
- Disable swap: Force applications to crash instead of thrashing
# Reduce swappiness to 10 (default 60)
sysctl vm.swappiness=10

# Persist across reboots
echo "vm.swappiness=10" >> /etc/sysctl.conf
6. OOM Killer Investigation
Scenario: Kernel randomly kills processes to free memory.
# Find OOM killer logs
dmesg | grep -E "Out of memory|oom-kill"

# Detailed OOM event
journalctl -u systemd-oomd -n 50 --no-pager
The OOM killer selects processes based on oom_score (memory footprint + age):
# Check OOM score for a process
cat /proc/$(pgrep -f myapp)/oom_score

# Reduce priority (tell kernel: "kill me last")
echo -500 > /proc/$(pgrep -f myapp)/oom_score_adj
7. Recommended Preventive Measures
- Set memory limits: Both Docker (
--memory) and Kubernetes (limits.memory) - Monitor trends: Use Prometheus + Grafana to alert on memory growth
- Regular restarts: Redeploy containers weekly if leaks are suspected
- Review code: Use
valgrindor language-specific profilers - Tune GC: For Java/Python apps, adjust garbage collection parameters
☕ Coffee Corner
Compiling, deploying, or waiting on a render? Here's what to brew while you wait.

🏠 Smart Home Picks
Same hobbyist care applied to your network and your front door.